Viewing Reports & Analytics
Go to Analytics → Overview in the WordPress admin sidebar. This is your analytics dashboard — it shows key performance cards at the top including Total sales, Net sales, Orders, and Average order value. Each card shows the current period’s figure, a percentage change compared to the previous period, and a small trend indicator. Below the cards is a chart showing your sales over time.
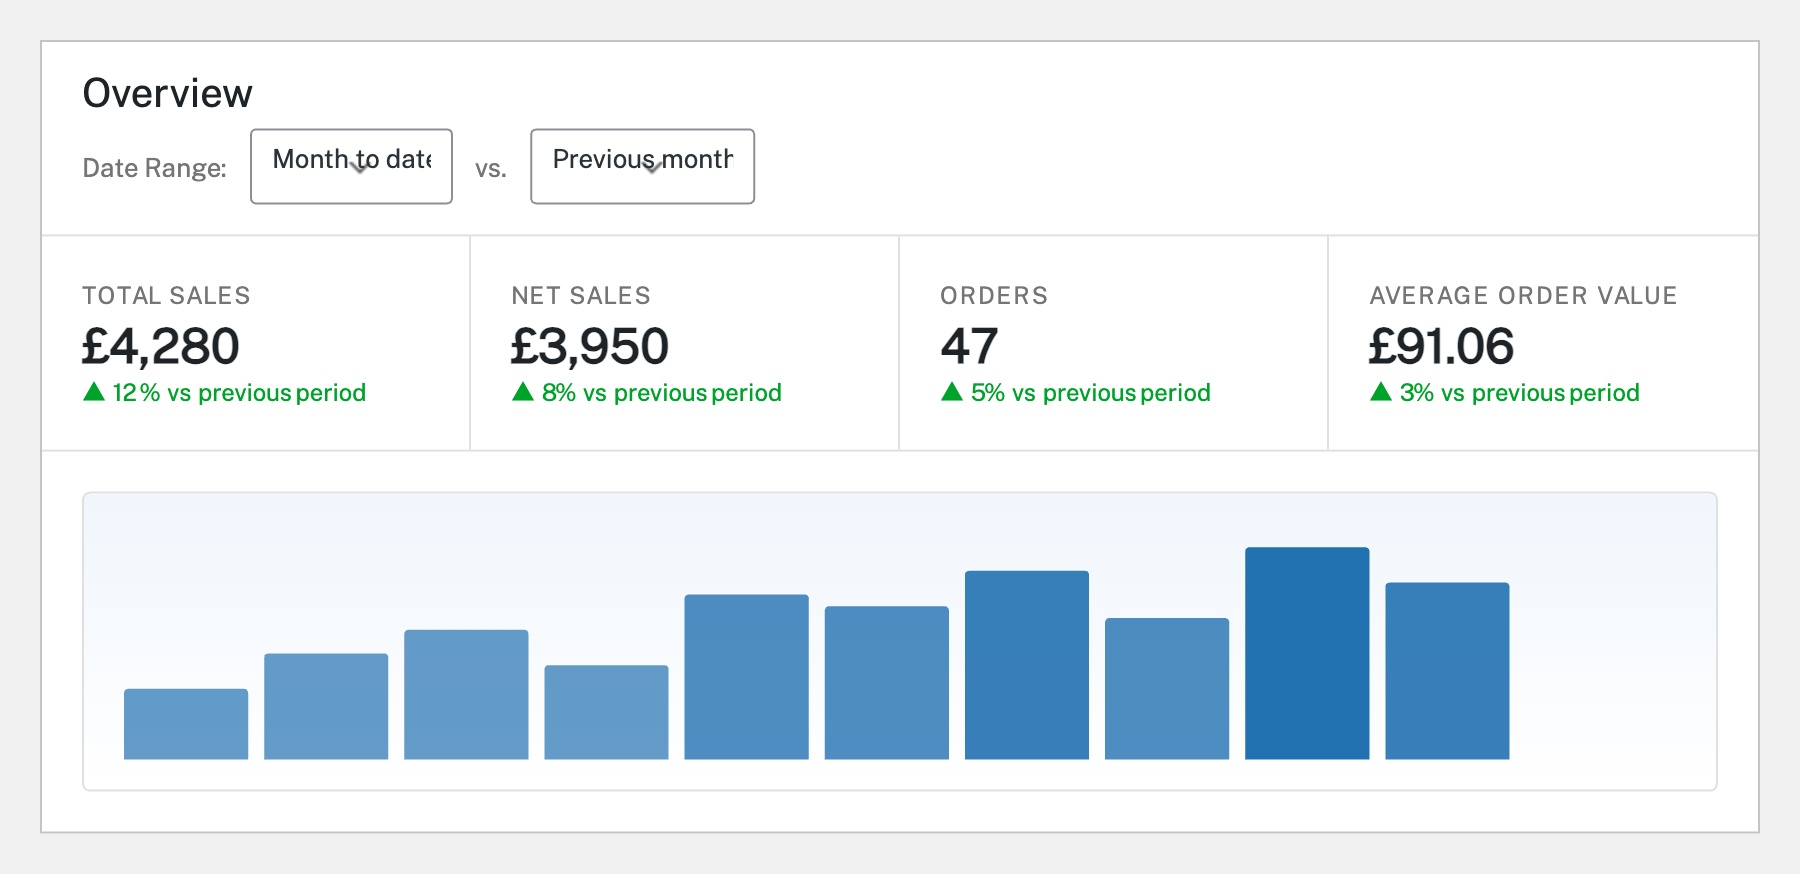
At the top of the Analytics overview, use the Date Range dropdown to select your reporting period (e.g. Month to date, Last month, Year to date, or Custom). The Compare to dropdown lets you choose what to measure against — typically the previous period. All the summary cards and charts update automatically when you change the date range. This makes it easy to spot trends and compare performance.
Below the chart on the Analytics Overview page, you’ll find Leaderboard tables. These show your Top Products (by items sold), Top Categories, and Top Customers (by spend) for the selected date range. This gives you a quick snapshot of what’s selling well and who your best customers are without needing to dig into detailed reports.
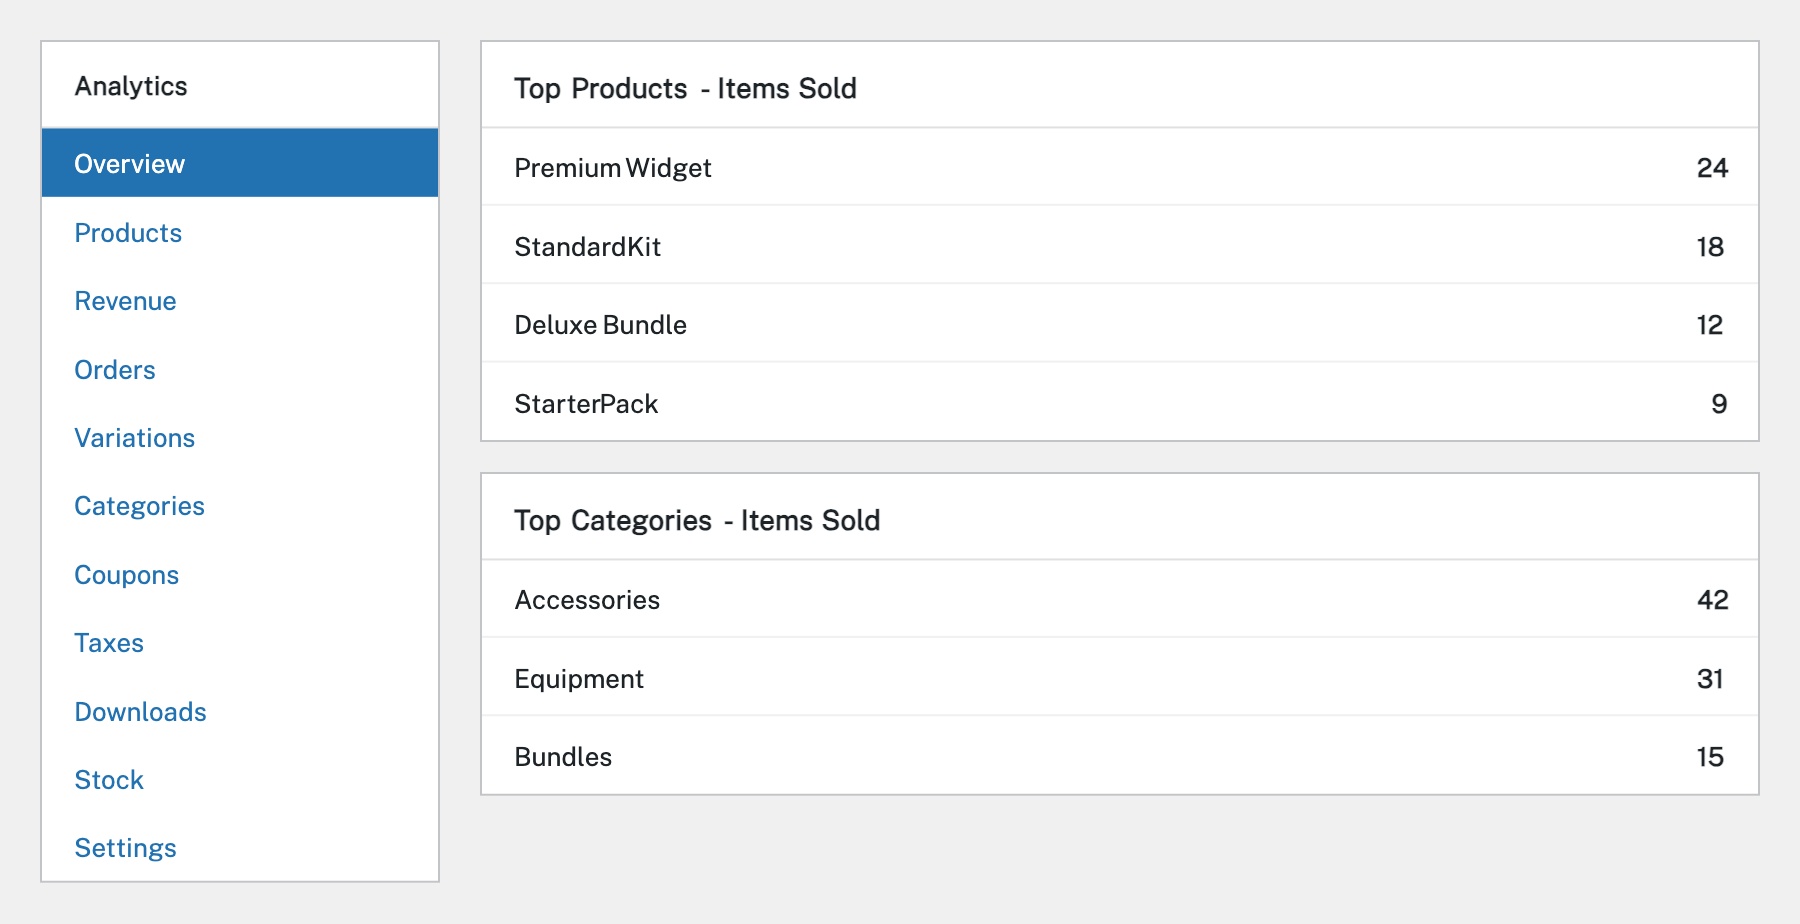
The Analytics sidebar menu has dedicated report sections: Products (individual product performance), Revenue (detailed revenue breakdown including coupons, taxes, shipping), Orders (order counts and averages), Variations (performance by product variation), Categories (sales by category), Coupons (coupon usage and discounts), Taxes (tax collected), and Downloads (digital product downloads). Each report has its own filters and chart.
Most Analytics reports include a Download button that exports the data as a CSV file. This is useful for importing into spreadsheets, sharing with your accountant, or doing further analysis outside WooCommerce. Set your desired date range and filters first, then click Download to export just the data you need. You can also use the Analytics → Settings page to configure which statuses count as ‘completed’ for reporting purposes.
Completed
If you are still experiencing issues, our support team is here to help.
Was this article helpful?